Graduate from Mixpanel: Funnel Analysis with SQL and R
Graduate from Mixpanel: Funnel Analysis with SQL and R
Graduate from Mixpanel: Funnel Analysis with SQL and R
This post is part one of a two part series. See part two here.
What is Funnel Analysis?
In a nutshell, funnel analysis allows you to follow a user through a series of self-defined events as well as, allowing you to calculate the given conversion rates between event to event. There are multiple ways and opinions on how to define a funnel analysis.The way I’ve developed here takes the time a series of events occurred and the order of their occurrence into consideration.
Just like the real-world tool, a funnel moves objects from one area to another through a bottleneck. An example of a web-based funnel would be a user hitting your web store’s homepage, then placing an item in the basket, and finally checking out.
I prefer a funnel where it is impossible, or very difficult, to complete later stages of the funnel before going through the earlier stages. It’s a more conservative approach, which is useful if you want to improve user’s movement through a defined pathway. The analysis below assumes this type of funnel structure. It’s also useful for funnels where each step can be done out of order, but a conversion will only count if the steps were done in order, with the risk that this could lead to underestimating.
Prepping your data
For ease of using the queries I’ve defined below, I assume a simple data structure of the following schema:
| Time | User | Event | |
|---|---|---|---|
| Description | The timestamp of when the event occurred | The unique user ID | The event the user performed |
| Example | January 01, 2016 12:00:000 GST | abc123 | Login |
Luckily, I already have a table called events that logs every event within our website, the user, and the time, along with other information. Depending on how you have your tables set up, you might have to do some prep to get it into the above structure.
The analysis below will use a simple funnel of three events:
- Event 1 : Land on homepage
- Event 2 : Place item in cart
- Event 3 : Purchase item
Calculating the Funnel
Before showing the final query, I want to quickly walk through each part of the query for ease of understanding my methodology.
Defining the Scope
I wanted to create a query that makes it easy to both define the time frame allowed from funnel start to completion, and to easily switch out the funnel events. Whether you want to look at a week of data, or the last 90 days, I wanted to easily switch out the dates. Similarly, switching out events in a funnel with the same amount of steps should be as trivial as changing filters.
Adding or subtracting events to the funnel take a bit more work, but only require careful deleting or pasting similar lines of logic.
I’ll define query_1 as below:
SELECT user_id, event, MIN(time) AS first_occurance

FROM events

WHERE td_time_range(time, '2015-12-01', '2016-01-01')
      AND event IN('homepage','put_item_in_cart','checkout')
      AND user_id IS NOT NULL

GROUP BY user_id, event
;
My goal with the above query is to find the first occurrence of when a user performed each of the events, if they performed them at all.
Notice in query_1, I have defined my timeframe as the month of December using the Treasure Data provided UDF td_time_range. I search for all relevant events at once, as well as making sure not to capture any events that may not have a defined user.
Transposing the Data
Currently, we have a long table, meaning each user has multiple entries, one for each event that the user performed. Next, we will transform that table from one that is long to one that is wide.
We’ll go from data like this:
| user_id | event | first_occurance (in long format) |
|---|---|---|
| 123 | homepage | 13413223 |
| 123 | put_item_in_cart | 13415841 |
| 123 | checkout | 13416013 |
| 456 | homepage | 13984713 |
| 456 | put_item_in_cart | 13984890 |
To like this:
| user_id | homepage | put_item_in_cart | checkout |
|---|---|---|---|
| 123 | 13413223 | 13415841 | 13416013 |
| 456 | 13984713 | 13984890 | NULL |
This format will allow us to compare events within the context of each user and if they made it through the pipeline in the proper order.
query_2 is defined as below:
SELECT user_id,
       MAX(CASE WHEN (event = 'homepage') THEN first_occurance ELSE NULL END) AS homepage,
       MAX(CASE WHEN (event = 'put_item_in_cart') THEN first_occurance ELSE NULL END) AS put_item_in_cart,
       MAX(CASE WHEN (event = 'checkout') THEN first_occurance ELSE NULL END) AS checkout

FROM query_1

GROUP BY user_id
;
Calculating the Funnel
In addition to calculating the counts of each user as they move through the funnel, I’ve also included total counts of all users who have performed that event outside of our defined funnel rules. This will allow insight into whether or not the funnel is appropriately designed.
A well designed funnel should show similar counts between the funnel count and the total count. A large discrepancy between the two may indicate that users are using your site differently than you have designed it.
We define query_3 as below:
SELECT
  COUNT(homepage) AS homepage_total_count,
  COUNT(put_item_in_cart) AS put_item_in_cart_total_count,
  COUNT(checkout) AS checkout_total_count,
  SUM(CASE WHEN (homepage < put_item_in_cart) THEN 1 ELSE 0 END) AS conversion_1_2,
  SUM(CASE WHEN (homepage < put_item_in_cart
                 AND put_item_in_cart < checkout) THEN 1 ELSE 0 END) AS conversion_2_3

FROM query_2
;
Earlier, we defined that the first occurrence of the first event in our funnel as the start of the clock. Luckily, homepage_total_count does double duty as it is both the count of start of the funnel as well as the count of all users who performed the event.
Finally, putting together query_1, query_2, and query_3 we are able to obtain one query that calculates the funnel from start to finish.
SELECT
  COUNT(homepage) AS homepage_total_count,
  COUNT(put_item_in_cart) AS put_item_in_cart_total_count,
  COUNT(checkout) AS checkout_total_count,
  SUM(CASE WHEN (homepage < put_item_in_cart) THEN 1 ELSE 0 END) AS conversion_1_2,
  SUM(CASE WHEN (homepage < put_item_in_cart AND put_item_in_cart < checkout) THEN 1 ELSE 0 END)
      AS conversion_2_3

FROM (SELECT
         user_id,
         MAX(CASE WHEN (event = 'homepage') THEN first_occurance ELSE NULL END) AS homepage,
         MAX(CASE WHEN (event = 'put_item_in_cart') THEN first_occurance ELSE NULL END)
            AS put_item_in_cart,
         MAX(CASE WHEN (event = 'checkout') THEN first_occurance ELSE NULL END) AS checkout

      FROM (SELECT user_id, event, MIN(time) AS first_occurance
            FROM events
            WHERE td_time_range(time, 'START_TIME','END_TIME')
               AND event IN('homepage','put_item_in_cart','checkout')
               AND user_id IS NOT NULL
            GROUP BY user_id, event) a

      GROUP BY user_id)
;
Which returns the following results:
| homepage | put_item_in_cart | checkout | conversion_1_2 | conversion_2_3 |
|---|---|---|---|---|
| 714 | 166 | 165 | 97 | 15 |
Visualizing the Data
Now that we have our final counts, let’s move to R to help visualize the data. We’ll have to some minor transformations before visualizing the data using the ggplot2 package. For code simplicity’s sake, I’ve removed any options that change the aesthetics of the graph and ask you to refer to the official ggplot2 documentation if you wish to change the color and format of the graph.
Let df be the dataframe of the data that we produced above. Using the melt() from the reshape2 package, I can reformat the data to make it easier to use with ggplot2:
m_funnel = melt(funnel)
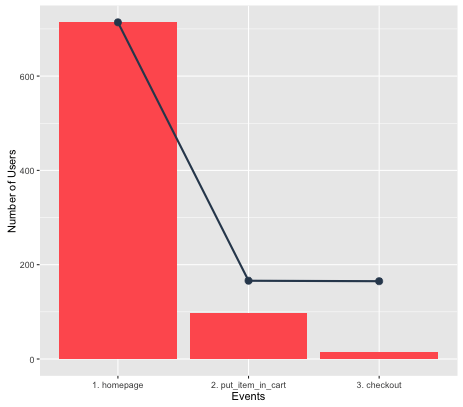
events = c("1. homepage", "2. put_item_in_cart", "3. checkout")
total_users = t_funnel$counts[1:3]
conversion_users = t_funnel$counts[c(1,4,5)]
final2 = data.frame(events, total_users, conversion_users)
Then to create the graph:
gg = ggplot(final2) + geom_bar(aes(events, conversion_users), stat="identity")
gg = gg + geom_point(aes(events, total_users), stat="identity")
gg = gg + geom_line(aes(events, total_users), stat="identity", group = 1)
gg = update_labels(gg, list(x='Events', y="Number of Users"))
gg
Which produces the image below. (Remember, I’ve stripped out any formatting code).
Next Steps
While this analysis is useful for looking at how your funnel is performing within a defined time period, I prefer analyses that gives context to the current funnel performance. In Using SQL and R to do Funnel Analysis – Part Two, I’ll show how to calculate conversation events and compare your funnel analysis by month over a six month period.