Fluentd, Kubernetes and Google Cloud Platform – A Few Recipes for Streaming Logging
Fluentd, Kubernetes and Google Cloud Platform – A Few Recipes for Streaming Logging
Fluentd, Kubernetes and Google Cloud Platform – A Few Recipes for Streaming Logging
Maybe you already know about Fluentd’s unified logging layer. Maybe you are already familiar with the idea that logs are streams, not files, thus it’s necessary to think of a logging layer dynamically this way.
Actually, it’s that very last point that lends a crucial understanding to how fluentd is configured. It’s all about how we handle the different elements of the stream: where we get that data from, what we do with it when we get it, where we send the processed data to, and how we handle it as we send it on its way. In this blog, we’ll review these concepts and apply them in the following “recipes”:
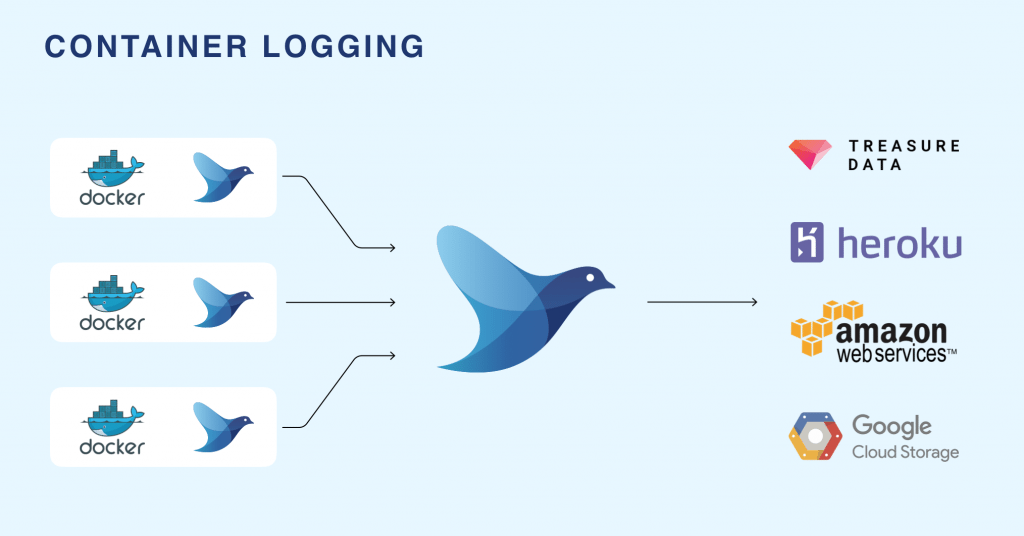
- Logging stdout commands from a Docker container (but keeping the config when the container dies!)
- Handling JSON logs
- Sorting messages by levels
- Splitting the data stream to two destinations
As it turns out, Google Cloud Platform and Kubernetes now include fluentd logging layer output as a default so that you can do precisely such things, but first, let’s look at the directives in a fluentd.conf file:
- source directives determine the input sources.
- match directives determine the output destinations.
- filter directives determine the event processing pipelines.
- system directives set system wide configuration.
- label directives group the output and filter for internal routing.
- @include directives include other files.
A Basic Recipe (for logging docker stdout commands)
For our purposes today, we’ll be primarily concerned with source and match directives. Below is a sample configuration for logging stdout commands from a docker container directly to Treasure Data (and, since our configuration lives on the Ubuntu host, it doesn’t die with the Docker container!):
So, what’s happening here?
Our source directive tells us that we are using the forward input plug in, which tells fluentd to listen to a TCP socket to receive the event stream.
We have two match directives. The one at the end assumes we’ve set our logging option accordingly when we launched the container:
– -log-opt fluentd-tag=td.docker.{{.Name}}
This directive tells us to use the stdout plugin to print events to standard out.
However, it’s the first directive that’s the most interesting. Assuming the same logging options, we match everything that’s tagged td.*.* and, using the tdlog output plugin, send each console output as a single record to a Treasure Data Database named docker, where the table is also the name of the docker container:
auto_create_table creates tables on the first instance.
buffer_type file buffers to a file.
buffer_path specifies the path the the buffer file, on our docker container.
flush_interval 5s specifies a 5 second interval to flush the buffer and write to the Treasure Data table.
Are you starting to see how this works? For more specifics on fluentd configuration and parameters, see the related article.
Logging results to Google Cloud Platform

Ready to see how fluentd works with Google Cloud Platform? Let’s look at a few different scenarios. Thanks to the Kubernetes team for making these configurations (and ones like these) available on github.
Handling JSON Logs
Here, we’re tailing our logs in JSON and logging the results to Kubernetes. We have to work with the timestamp, so we’ve included the time_key and the time_format directives. Lastly, we’re tagging the data stream with kubernetes and the appropriate unique suffix. We’ve also specified a position file and set read_from_head to true. This enables us to stop and restart processing if, for some reason, our stream is interrupted.
Sorting out messages by different levels
We can tail different messages, using regular expressions to look for parts of the message like format, level (severity), message, error (if any) and Status Code. Note that we must parse the time format on input. Again, we’re using a position file to keep our place in the stream. We should include a match section to route the data to a specific destination.
Splitting the data stream to two destinations
Here, we’re parsing the autoscaler log, managing our buffer, queue and chunk sizes, and, in the cases of both destinations (namely, GCP and kubernetes), we retry forever.
What’s next?
Would you to build the easiest possible logging infrastructure you can? Get Fluentd!
There are more than two hundred input, output, and other plugins here. Here you can see them sorted in descending order by popularity here:
If you are interested in seeing the plug-ins by category, go here:
Last but not least, get Treasure Data (you can sign up for a 14 day trial at treasuredata.com. You can always ask us if you need any help!
If you are interested in deploying Fluentd + Kubernetes/Docker at scale, check out our Fluentd Enterprise offering.