Big Data Visualization with Tableau and Treasure Data
Big Data Visualization with Tableau and Treasure Data
Big Data Visualization with Tableau and Treasure Data
At Treasure Data, we want to make the process of collecting, storing and analyzing data simple and easy. To that end, we’ve launched the Tableau Server Result Output: a feature to write Treasure Data’s job result into Tableau Server or Tableau Online. This feature allows you to build a highly interactive and scalable BI environment by combining Tableau and Treasure Data.
How it Works
Treasure Data has been heavily investing in our Result Output feature, which allows users to export the result of a job into other systems. The new Tableau Result Output feature allows Treasure Data users to put the query result directly into Tableau Server from Treasure Data.
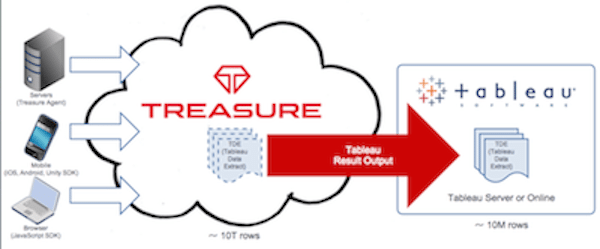
Internally, we’re converting the job result into a TDE (Tableau Data Extract) file. TDE is Tableau’s proprietary columnar format for optimal performance (see Why Use Tableau Data Extracts). Once you convert the data to a TDE file and upload it to Tableau Server, all additional data processing can be done by Tableau’s in-memory columnar engine. While this engine provides excellent performance, it’s not suitable for storing billions of records. By combining Treasure Data and Tableau Server, you can collect and aggregate trillions of records in Treasure Data and aggregate and summarize those to millions of records for visual analytics in Tableau.
How to Use
Start by visiting the query editor on the Treasure Data Service web console, and type in your query. The example Hive query below uses the access log example data set, and calculates the distribution of HTTP method per day.
SELECT
  CAST(TD_TIME_FORMAT(time, 'yyyy-MM-dd 00:00:00') AS timestamp) AS `Datetime`,
  method as `Method` COUNT(1) AS `Count`
FROM
  www_access
GROUP BY
  TD_TIME_FORMAT(time, 'yyyy-MM-dd 00:00:00'),
  method
Next, please select ‘Tableau Server’ from the ‘Result Export’ section. A dialog box like below will appear.
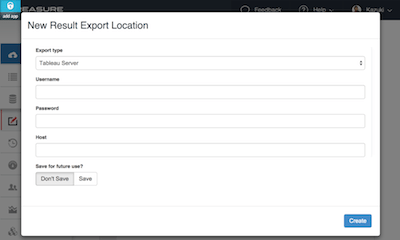
https://www.treasuredata.com/img/tde-3.png
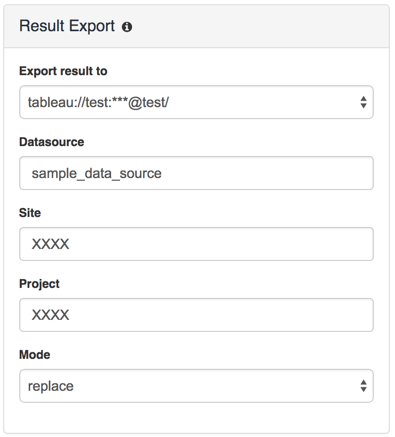
Finally, please fill in the name of ‘Datasource’ (TDE filename), ‘Site’, ‘Project’, and Mode. Please visit the URLs below for a list of projects and sites. Let’s use replace mode for now.
- List of Sites: https://TABLEAU_SERVER_URL/sites
- List of Projects: https://TABLEAU_SERVER_URL/t/YOUR_SITE_NAME/projects
After filling in all the fields, Submit the query. The system will execute the query, create the TDE file, and finally upload the TDE to Tableau Server.
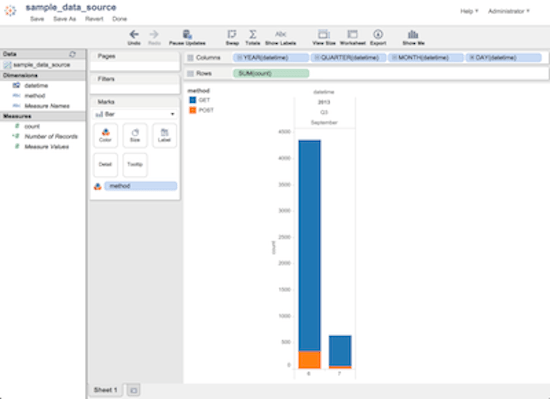
Now visit your Tableau Server, and click the ‘Data Sources’ section at the top left bar. This will show the list of data sources, and your TDE file should appear there.
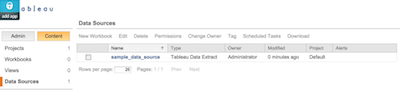
By clicking ‘New Workbook’, you can create charts and dashboards from the browser. Drag and drop the dimensions & measures from the left nav to the top right nav to create the graphs. Then click ‘Save’ to store the result.
Getting Started
Interested? Let’s get started now in the cloud:
Additional Reading
For further information, you can refer to our documentation. Enjoy!
- https://docs.treasuredata.com/articles/result-into-tableau-server
- https://docs.treasuredata.com/articles/result-into-tableau-online
These blog articles are extremely helpful in explaining how Tableau Data Extract files work.