4 Steps to Big Data Analytics with Tableau and Treasure Data
4 Steps to Big Data Analytics with Tableau and Treasure Data
4 Steps to Big Data Analytics with Tableau and Treasure Data
While Treasure Data is a BI tool agnostic service, customers like retailer MUJI are using Tableau for the BI / Visual Analytics. In this article, we want to introduce our customers’ usage pattern of combining Treasure Data, Tableau Desktop and Tableau Server. Let’s begin with understanding the characteristics of each solutions.
What is Tableau?
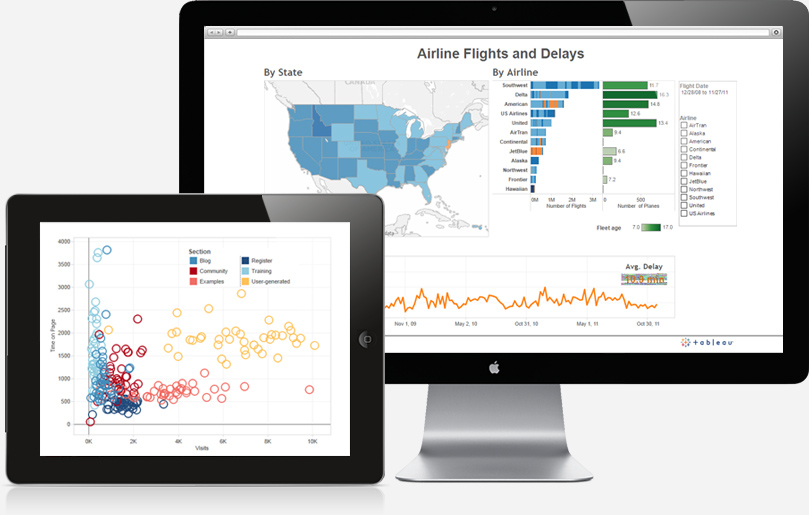
Tableau is business intelligence software that helps people see and understand their data. There are two major products provided by Tableau Software: Tableau Desktop and Tableau Server.
Tableau Desktop is a Desktop Application (Windows or Mac), to visualize and analyze data, and create workbooks, visualizations, dashboards and stories. It can publish these to Tableau Server for sharing information within an organization. In short, Tableau Desktop is a BI designer tool, while Tableau Server is a publishing environment to share the the charts. Tableau Online is a hosted version of Tableau Server, which doesn’t require you to manage the BI server.
- Tableau Desktop Product Tour (Video)
- Tableau Server Product Tour (Video)
What is Treasure Data?
Treasure Data is cloud-based, managed service for data and analytics. Treasure Data empowers data-driven companies to focus on insights, not infrastructure. Users can store trillions of records in the cloud by collecting semi-structured big data in real-time, and aggregate the data by using one of several query engines. Often times, those results will be fed to a data warehouse or reporting server for consumption by additional end-users.
- Treasure Data Introduction (Video)
Tableau + Treasure Data Reference Architecture
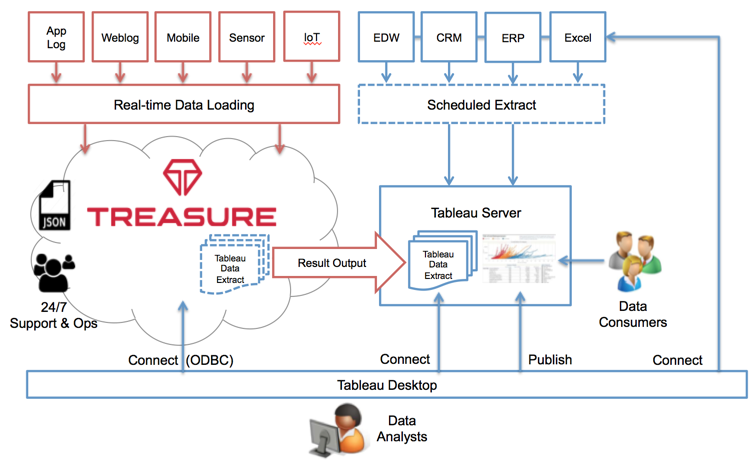
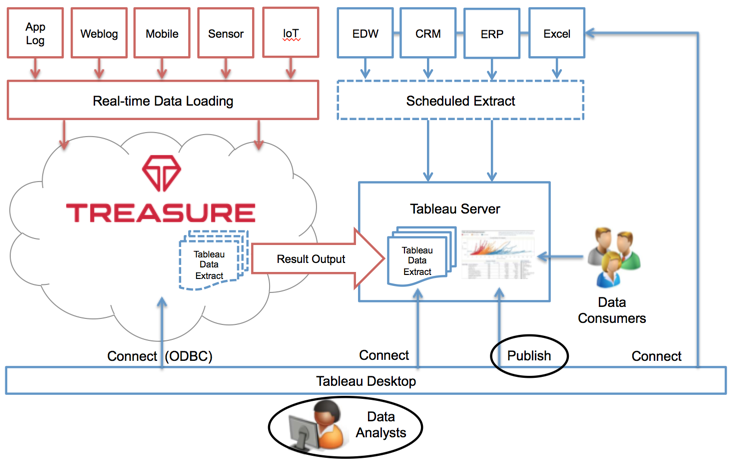
So why combine Treasure Data & Tableau? Treasure Data provides a scalable backend to handle new big data sources (application logs, web logs, mobile data, sensor data, etc), while Tableau provides flexible visual analytics for existing data sources (EDW, CRM, ERP, etc). By combining Treasure Data and Tableau, you can get the insights from any data sources of any size quickly. Here’s a reference architecture diagram. Let’s see how it works step by step.
Step1: Collect Big Data (Treasure Data)
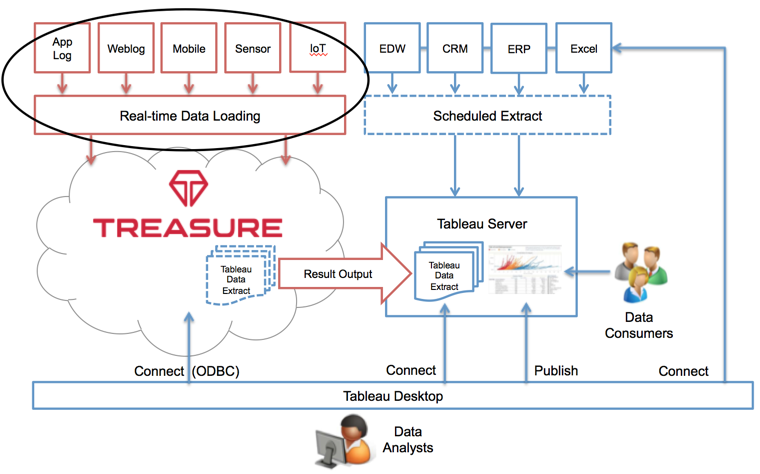
First, let’s start collecting data into Treasure Data. Treasure Data provides a various ways to collect data in near-real-time into the cloud. The data sources depicted here are ‘time-series’ data, which means there is historical data, produced in real time, and growing rapidly as your business scales. Here are the four main data collection capabilities provided by Treasure Data:
- Treasure Agent for streaming data collection
- JavaScript SDK for website tracking
- Mobile SDK (Android, iOS, Unity) for mobile application tracking
- Bulk Loader for parallel bulk loading
Treasure Data is now importing almost 400,000 records per second, and all Treasure Data customers receive the benefits of this scale. Setting up the data collection usually takes only a couple of hours, or even a few minutes in some cases.
Step2: Aggregate Big Data (Treasure Data)
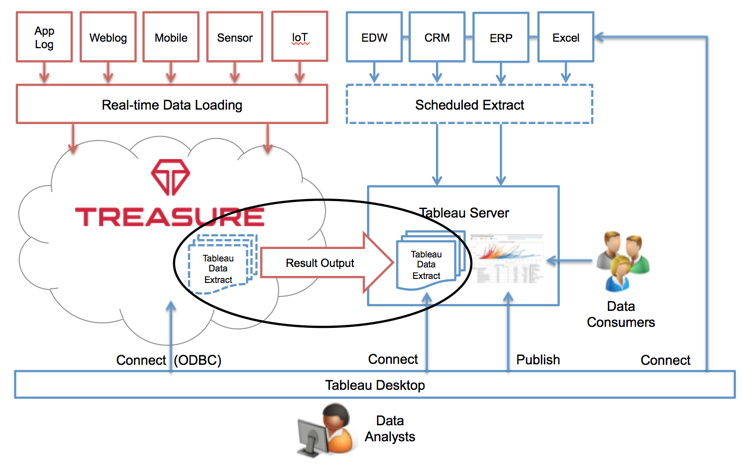
Now we have raw data in the cloud. To provide a better experience for the report data consumers, it’s a good idea to summarize data into smaller sets for performance reasons. By using one of Treasure Data’s embedded query engines, you can crunch big data into the aggregated format. Treasure Data supports ‘Tableau Result Output’ so you can directly push the aggregated results into Tableau Server. You don’t need any additional infrastructure to do this.
Treasure Data pushes the results as a ‘Tableau Data Extract‘ (TDE) file. TDE is a Tableau’s proprietary columnar file format, optimized for efficiently slicing and dicing data (see Why Use Tableau Data Extracts). The TDE file will be directly located into Tableau Server.
Step3: Design Workbooks (Tableau Desktop)
Now we have raw data access, and aggregated data too. It’s time to explore the data, and Tableau Desktop is the tool for this.
First, Tableau Desktop has a lot of built-in connectors for existing data sources (EDW, CRM, ERP, Excel, etc), so you can interact with them directly.
Next, Tableau Desktop can interact with Tableau Server, so that Tableau Desktop can directly interect with TDE files on Tableau Server. You can create the dashboard using TDE files on Tableau Server too. Every time you drag & drop the columns on your Desktop, the data is processed at the Server side. If you have too much network latency between Server and Desktop, you can download the TDE file to your local disk.
Third, Treasure Data provides an ODBC driver for Tableau Desktop so that data analyst can have raw data access.
Analysts can choose one of three methods depending on the needs. You can also join across these data sources. For example, you can join between Salesforce.com data and a TDE file, or even join between TDE multiple files. Once the workbook is created, Tableau Desktop can publish it to Tableau Server.
Step4: Share the Workbooks (Tableau Server)
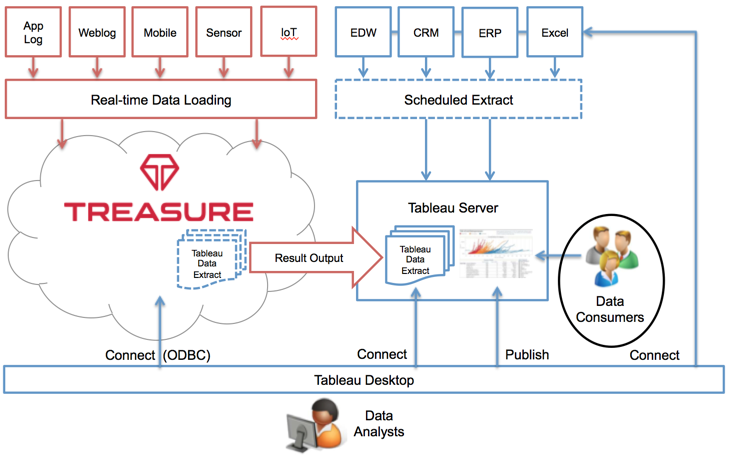
Now everything is set. Analysts can publish workbooks to the server, then the data consumers can see them from their browsers. The beauty is analysts can quickly iterate on the data and reports by having access to all the data sources, so they’re now self-reliant.
- Publishing to Tableau Server (Documentation)
- Publishing to Tableau Server (Video)
Conclusion
Tableau + Treasure Data empowers data-driven companies to rapidly explore data and get insights. By combining these two solutions, people can focus on insights, not infrastructure, with an industry-leading visual analytics tool. If you have any questions, please contact to us.