Elasticsearch vs. Hadoop For Advanced Analytics
Elasticsearch vs. Hadoop For Advanced Analytics
Elasticsearch vs. Hadoop For Advanced Analytics
A Tale of Two Platforms
Elasticsearch is a great tool for document indexing and powerful full text search. Its JSON based Domain Specific query Language (DSL) is simple and powerful, making it the defacto standard for search integration in any web app. But is it good as an analytics backend? Are we looking at a true Hadoop killer?
Let’s start by remembering the context in which an advanced analytics system is typically built. This type of project is usually kicked off when your app has out grown a simple analytics tool like Mixpanel or Google Analytics, and product management’s questions are becoming more difficult to answer. “What’s the completion rate for female Chinese users in my newly defined cohort X through the revamped user action funnel Y?” Who knows?! These are questions you can only answer with custom queries to segment out cohort X user data long after it’s been ingested and tagged. So you decide to start collecting log data and build a full analytics pipeline. After a bit of research you find that, while a lot of legacy systems are built from the ground up on Hadoop, more and more developers are starting to think about Elasticsearch for this application. What’s going on here? Is a search engine really the best tool for analytics? Or are we just trying to make a shoe fit because it’s already there?
Elasticsearch For Analytics
Together with its open source Logstash product for server-side log tailing and its open source visualization tool Kibana, Elastic’s ELK analytics stack is gaining momentum in web analytics use cases for three reasons:
- It is very easy to get a toy instance of Elasticsearch running with a small sample dataset.
- Elasticsearch’s JSON based query language is much easier to master than more complex systems like Hadoop’s MapReduce.
- Application developers are more comfortable maintaining a second Elasticsearch instance over a completely new technology stack like Hadoop.
These reasons are compelling to young analytics teams looking to get something up and running fast. But how does a search engine perform in comparison to a highly scalable distributed data platform when it comes to data ingestion and complex data analysis?
Streaming Ingestion
Right out of the gate, many teams stumble with Elasticsearch’s streaming ingestion limitations as soon as scale into production. Turns out there’s a well documented problem of split brain that can occur when network outages cut connections between Elasticsearch nodes. Unlike what you’ll see in your toy instance, your production scale Elasticsearch cluster will often span multiple racks in a data center. Severing any connection between master nodes causes Elasticsearch’s concurrency to breakdown, and can cause up to 100% loss of streaming data ingested during the period of the outage [1][2][3][4].
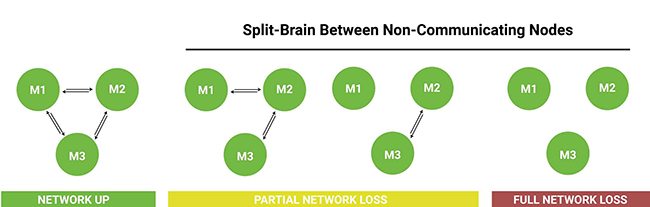
Various Network Failure Modes Between Elasticsearch Nodes
Network reliability at data-centers is extremely difficult to track, but industry feedback suggests that these types of failures can be up to a daily occurrence at AWS sites [5]. Even though Elastic’s engineers have been working hard to address this problem, bringing the total amount of data loss during a network failure down from around 90% to comparatively negligible amounts, tests as recent as April 2015 still find that Elasticsearch instances drop data in all network failure modes evaluated [6][7].
This is ok if you’re just capturing data from routinely repeatable tasks like web-crawling. But streaming analytics data is non-reproducible. Those users will never return to your app and execute that same set of events again. There’s no replay option in Logstash either. Once that data falls through the cracks, it’s gone forever. This means if you care about the integrity of your analytics dataset, you should store your data in an actual database like Hadoop, MongoDB, or Amazon Redshift, and periodically replicate it into your Elasticsearch instance for analytics. Elasticsearch on its own should not be the sole system of record for your analytics pipeline.
This new persistence layer (often called a data lake by industry practitioners) adds a significant level of complexity to what initially seemed like an easy solution. Logstash doesn’t support output to any mainstream databases other than MongoDB [8], so you’ll need to find another alternative on that layer too. Fortunately, the open source framework Fluentd that we’ve build at Treasure Data has seen tremendous adoption, with close to 500 developer contributed plugins [9]. Fluentd includes a suite of modern collection features like in-flight data encryption, de-duplication, edge node buffering, and automatic retries to backfill corrupted packets. And it also supports real-time feed splitting between multiple data sources, making it really easy to set up a lambda architecture where data can be sent to Hadoop or Amazon S3 for reliable archival, and to Elasticsearch for real-time analysis.

Lambda Architecture With Fluentd
Of course, even this architecture would have the same split-brain data loss issue on the Elasticsearch side, so if a few holes in your analytics reports are a complete show stopper, you’ll be better off setting up a data lake like Treasure Data in front of Elasticsearch, and using our newly launched Elasticsearch connector to load data reliably into your Elastic cluster.

Lossless Data Pipeline with Elasticsearch For Analytics
Production Resource Management
Configuring an Elasticsearch instance for stability in production can also more difficult than it seems at first. There’s a lot of trial and error involved, and many settings need to be tweaked as data volumes scale in production [10].
For example: the number of shards per index must be set at the initial creation of the index, and can only be changed by creating a brand new index. This means you have to guess the size of your data before you actually know what it will be. Setting too many shards for a small dataset can create unnecessary fragmentation that degrades search performance, while choosing too few shards for a large dataset can cause your cluster to hit the shard’s maximum size limit as it grows.
To combat this problem, Shay Banon, the founder of Elasticsearch, recommends creating time-bracket indexes for streaming data, to prevent the dataset from growing endlessly without bounds [11]. This is ok if all you’re doing is quick look backs over 30 day windows, but introduces a lot of complexities in your queries when you want to look back over a year’s worth of data spanning 26 indexes or more. It also creates index management headaches as your historical dataset grows and must be archived yet still remain available for occasional querying.
Schema-Free ≠ Pain Free Uploads
You may have been lead to believe, by Hadoop or other NoSQL technologies, that Schemaless means hassle free upload of data in any key/value format. This is not the case with Elasticsearch. While you can just throw anything into it, Elastic strongly recommends you transform any data that has varying key field values into more generic key value pairs [13]. For example:
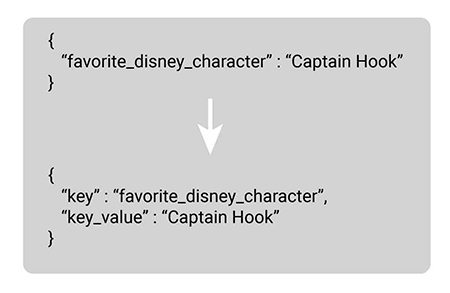
Elastic’s Suggested JSON Transformation
It turns out that without this, Lucene will create an index for each custom key value, causing the size of your Elasticsearch instance to explode over time [14][15]. This transformation is a huge resource sync when iterating over millions of rows of historical analytics data. It also forces you to keep updating your Grok patterns in Logstash every time your system starts tracking a new event.
Time Consuming Bulk Uploads
Another painful issue when working with large datasets in Elasticsearch is its handling of bulk uploads. As mentioned before, the default buffer limit for POST is 100 Mb, which works well for uploading a small sample dataset and playing around on your terminal. If the upload stream exceeds this limit at any time, Elasticsearch issues a silent OutOfMemory error and aborts. The data that was indexed prior to the memory error is still available for querying in the cluster, which means it can take a while to figure out something went wrong. [16]. Not to mention the fact that uploads can take hours, only to fail and have to be retried.
Lack of Powerful Analytics Functions
Elasticsearch’s aggregation and full-text search functions are great for answering basic web analytics questions like counts on 404 errors, pageviews, and simple demographic information. But it lacks the full power of window functions that come standard in SQL. These functions allow you to answer bigger questions such as top viewed pages broken out by country, moving averages on key metrics, or pre-trigger event traces, with a single query. Elasticsearch doesn’t support the output of query results into intermediate datasets for additional processing or analysis, nor does it support transformation of datasets, (i.e. a 1 billion row table on it’s way to becoming another 1 billion row table). Instead, your analysis is more-or-less limited to what a search tool does best: aggregating data into smaller sets according to filtering parameters [17]. This is great if you’re just looking to replicate Google Analytics functionality in Kibana, but the whole point of this exercise is to unlock more complex analysis.
Also missing are complex manipulation features like JOINs. Elasticsearch compensates for this by allowing the pipeline to set up-front alias fields on documents, for example: setting an user_name alias on each interaction event so a join with a user table isn’t required. It also supports the nesting of documents, for example: nesting click events under a user_persona document. This requires even more data pre-processing in ETL pipelines, and forces you to specify how you want to interact with future data at the ingestion stage. Elasticsearch on its own does not support the full flexibility of historical analysis common in other types of datastores [18].
What About Hadoop?
How does all this stack up against Hadoop, the industry stalwart for distributed data processing [19]. For starters, HDFS separates data from state in its node architecture, using one over-arching node that manages state for the entire cluster, and several daughter nodes that store only data [20]. These data nodes execute commands from their master node and log all operations in a static file. This allows a replica master to quickly recreate the state of the system without needing to talk to another master node during fallback. This makes the system extremely fault tolerant, and prevents the split-brain scenario that causes data loss amongst masters that must communicate with each other to restore state.
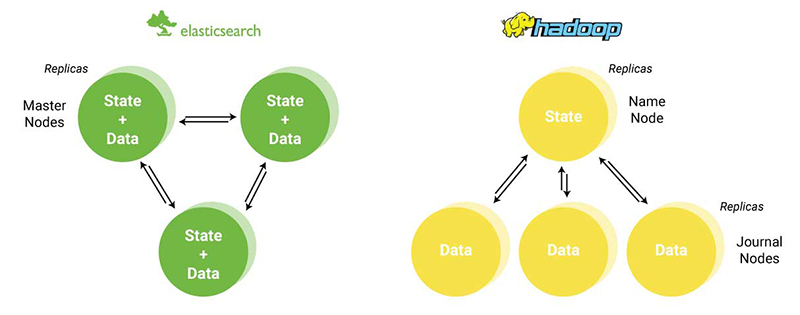
Architecture Comparison: Elasticsearch v. Hadoop
Hadoop also has a broad ecosystem of tools that support bulk uploading and ingestion of data, along with SQL engines to support the full querying power you expect from a standard database. On the other hand, it can be argued that standing up Hadoop, Zookeeper, and a Kafka ingestion agent requires as much domain specific knowledge as Elasticsearch. Thus, the raw power and stability of Hadoop comes at the price of heavy setup and maintenance costs.
Hadoop’s powerful MapReduce query framework is robust enough to handle any data aggregation or transformation job. But mastering the intricacies of MapReduce is a high overhead for the simple operations needed in most web analytics tasks. This means an analytics systems built on Hadoop will also need to deploy a query engine layer, driven either by HiveQL or Facebook’s real-time Presto engine, so analysts can interact with the dataset using familiar SQL instead of MapReduce. These engines are incredibly powerful, but add an additional layer of complexity to the analytics infrastructure.
Conclusion: Hadoop Still Wins
Even with these caveats, Hadoop remains the reigning champion in the analytics world. While Elasticsearch is a great tool for simple web analytics, its unforgivable sin of streaming data loss during ingestion, and arduous data ETL process make it untenable as the foundation of a complete analytics system. It’s a great tool for toy analytics and plug-and-play visualization, but its production scalability issues mean this technology still isn’t ready for prime time.
Implementing a Hadoop instance as the backbone of an analytics system has a steep learning curve, but it’s well worth your effort. In the end, the system will enjoy increased stability with rock solid ingestion and broad compatibility with a number of third party analytics tools, including Elasticsearch via the Elasticsearch-Hadoop connector. On the other hand, if you’d like avoid having to stand-up a full fledged Hadoop cluster on your own, check out Treasure Data. We’re a cloud based solution that can integrate with your web or mobile app in just a few lines of code and start capturing data instantly. We let you store and query the raw data in a schema-on-read data lake, and provide tools to run transformation or machine learning workflows that output to many third party destinations, including Elasticsearch.
Get the inside scoop and request a demo of our product.