Spark Community By the Numbers: A Few Surprises
Spark Community By the Numbers: A Few Surprises
Spark Community By the Numbers: A Few Surprises
Without a doubt, Apache Spark is taking the data science world by storm. An open-source, in-memory distributed data processing engine that can run atop Hadoop, Cassandra, and others, Spark has become a welcomed addition to the data scientist toolbox.
Growing in popularity, Spark is not without its naysayers. Some say it is unstable and not ready for widespread use. Others say that it’s primarily a “Silicon Valley” thing, and the rest of the world won’t necessarily follow suit.
One way to determine trends is to break down the Spark community. For this approach, data was generated using GitHub as the primary data source augmented by Clearbit’s excellent APIs. For more on how the data was collected, please skip to the Methodology section.
For now, let’s dig into the findings. The underlying data in the graphs below is as of October 10, 2015.
China Spark Adoption Outpacing U.S.
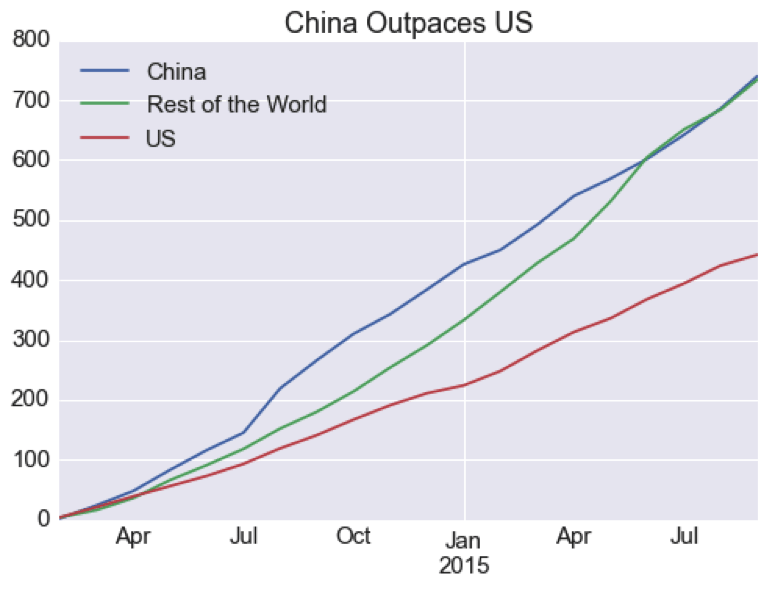
Admittedly, this data is based on a subset of GitHub stargazers. Even then, Spark’s traction in China is surprising. As Matt Asay wrote in 2014, building an open source business in China remains tricky.
California Leads U.S.
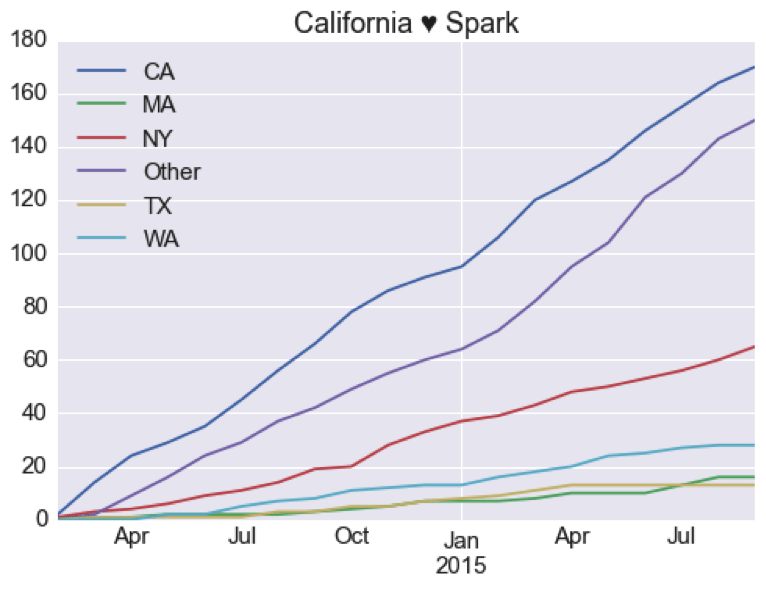
It’s encouraging to see that the “other” big software market has its eye on Spark: California is leading the trend in the U.S. A surprise is New York lagging well behind considering IBM is making a big bet on Spark. This, along with a growing cluster of data-savvy companies in New York City, the expectation is that New York should be growing much faster.
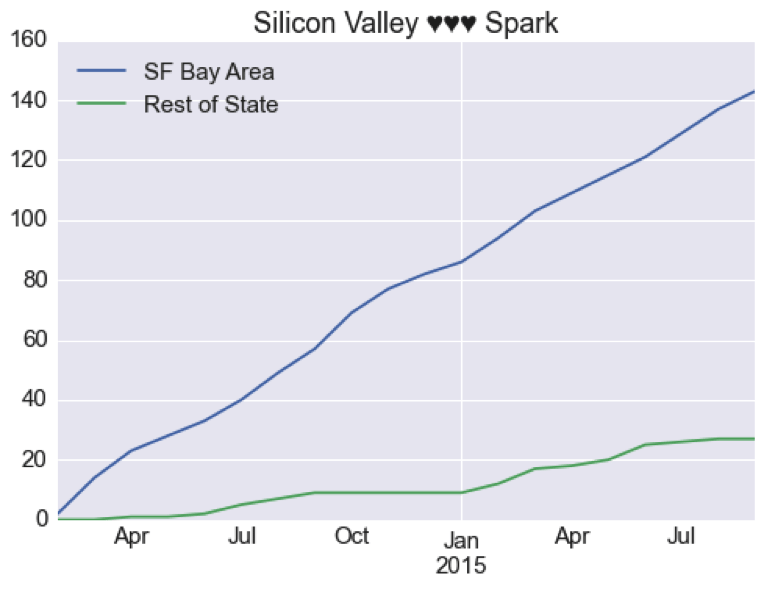
Below is the graph that compares Silicon Valley to the rest of the California. Clearly, Silicon Valley remains the testing ground of new software:
Spark is for Startups and Schools
For a subset of the users, data extraction included the companies that they work for. As shown below, most of Spark users work for private companies and/or educational organizations:
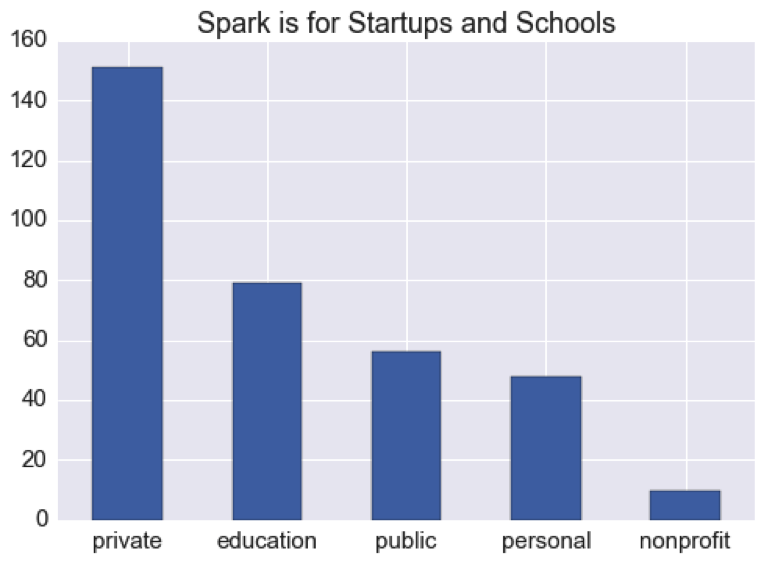
Considering Spark’s origin (AMPLab at UC Berkeley) and maturity (v1.0 released in March 2014), this is unsurprising. However, the number of public companies may be underrepresented here due to corporate rules about participating in open source projects or disclosing affiliations.
Gender Imbalance: Another Data Point
The gender breakdown of 2,134 Spark stargazers is 1,233 male, 34 female, 860 unidentified and 7 others according to Clearbit’s API evaluation of email addresses. That equates to 2.66% of the identified community as female.
How does this number stack up against other women in technology statistics? According to Tracy Chou of Pinterest, 18.89% of software engineers and 12% of Computer Science graduates are women. Compared to these numbers, the Spark community seems to be more male-dominant than the norm.
However, Alyssa Frazee’s research shows that women are significantly underrepresented or underreported on GitHub compared to the industry average. Broken down by programming language, at a mere 5.5%, R had the highest percentage of female repository ownership. While this isn’t encouraging for the future of software — and especially open source with GitHub as a proxy of women’s participation — the Spark community is closer to the average on GitHub than particularly gender-imbalanced.
So What?
- Spark is still early in its adoption curve with the strongest interest coming from startups and Silicon Valley companies.
- One less intuitive finding was Spark’s strong adoption in China. China has no shortage of new software engineers (over 100,000 a year), but historically, open source participation has been relatively small.
Here are some questions for the follow-up research:
- How does the Spark community data change if we used Forks instead of Stars as an indication of interest?
- How does Spark adoption in China compare to other data-related open-source projects?
- What other data sources can be used to measure Spark community trends (Spark mailing list, StackOverflow, etc.)? Would there be any difference?
Methodology
Spark stargazers were used as a proxy of interest. Octokit.rb was used to get metadata for each stargazer, most notably the date they starred the repository (script). Then, the listed emails were used to augment demographic information using Clearbit’s Python binding. The code looks simlar to:
import clearbit
for email in spark_users_with_email:
try:
combined = clearbit.Enrichment.find(email=email, stream=True)
if combined[‘response’].ok:
del combined[‘response’]
of.write(json.dumps(combined)+”n”)
else:
print >> sys.stderr, “FAILED: %s”%(email)
except:
print >> sys.stderr, “FAILED: %s”%(email)
The data from Clearbit was used to augment GitHub data such as gender, company affiliation, sanitized geography data, and so on. Once the data was put into the JSON-per-line format, all post processing was done with Pandas + Seaborn.