Integrate Zendesk, Salesforce, and MySQL for Support Analytics
Integrate Zendesk, Salesforce, and MySQL for Support Analytics
Integrate Zendesk, Salesforce, and MySQL for Support Analytics
Watch a video about this integration here.
At Treasure Data, we run our own Customer Support analytics. When a customer asks about a feature request, the state of an existing feature, or a bug, it’s critically important to us. In fact, they’re ALL critically important to us. In order to prioritize our responses, it’s every bit as important for us to know how often, where and from whom we are getting these requests.
Last year, we introduced Zendesk into our Treasure Data service to provide online chat and email support to our customers. However, in order to get good KPIs, we need to combine sources.
Today, we’ll describe our Customer Support use-case, using Treasure Data with Zendesk, Salesforce, and MySQL. We’ll also look at some visualizations we’ve done in Tableau.

This post illustrates the sort of integration you can do when you combine data sources. Your mileage may vary depending on your source data (which we cannot provide), so while we don’t expect you to be able to reproduce this particular integration step-for-step; we do want to walk you through our process to show you how simple it is.
Overview
Our system uses:
- Zendesk – for information related to support tickets;
- Salesforce – for customer information, including customer’s email, MRR (Monthly Recurring Revenue), contracted region, and so on;
- MySQL – for the “glue” that holds the other two sources of information together: account information, such as email address (originating from Zendesk) and account id (originating from Salesforce), is combined to a single index on our MySQL instance;
- Finally, Tableau – for data visualization.
Prerequisites
- Treasure Data Toolbelt installed.
- Zendesk, Salesforce and Tableau Server Online accounts and credentials.
- A MySQL instance.
We’ll be using the respective data connectors to schedule our data ingestion from each data source on a daily basis.
Ingesting Data from Zendesk
- Create a zendesk_seed.yml file:
- Create your database for Zendesk in Treasure Data and ‘guess’ the format for the incoming data:
- This will create a file called zendesk_ticket.yml.
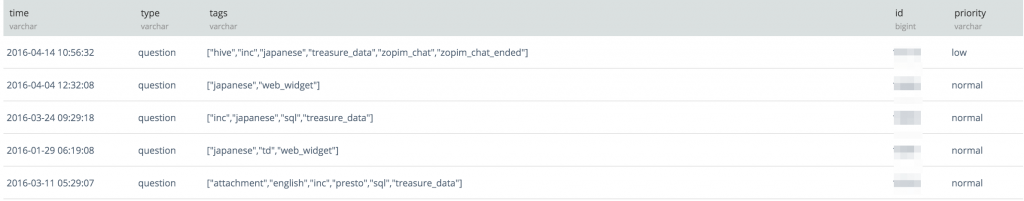
- “Preview” the incoming Zendesk data and ingest an initial ticket from Zendesk:
- Schedule loading Zendesk Data into Treasure Data:
Now, Data Connector will ingest ticket information from Zendesk to Treasure Data every day at 01:00 JST.
- Using the same steps, you can ingest other data from Zendesk into different Treasure Data tables: tickets, ticket_events, users, organizations, ticket_fields, ticket_forms, or ticket_metrics are all possibilities.
Ingesting Data from Salesforce and MySQL
Our blog and documentation provide the steps for connecting Treasure Data to Salesforce and ingesting data. Essentially, the steps are the same, but your salesforce_seed.yml will be different, as it requires different credentials and settings:
The same goes for ingesting from MySQL, although you can use either the local Embulk Connector or the Data Connector for MySQL. At Treasure Data, we use a batch server to dump the MySQL instance data to CSV, then upload it using our bulk import tool.
Putting it all together
Once your combined data from multiple sources is in Treasure Data, you can run queries (including joins) and export the result to Tableau Server.
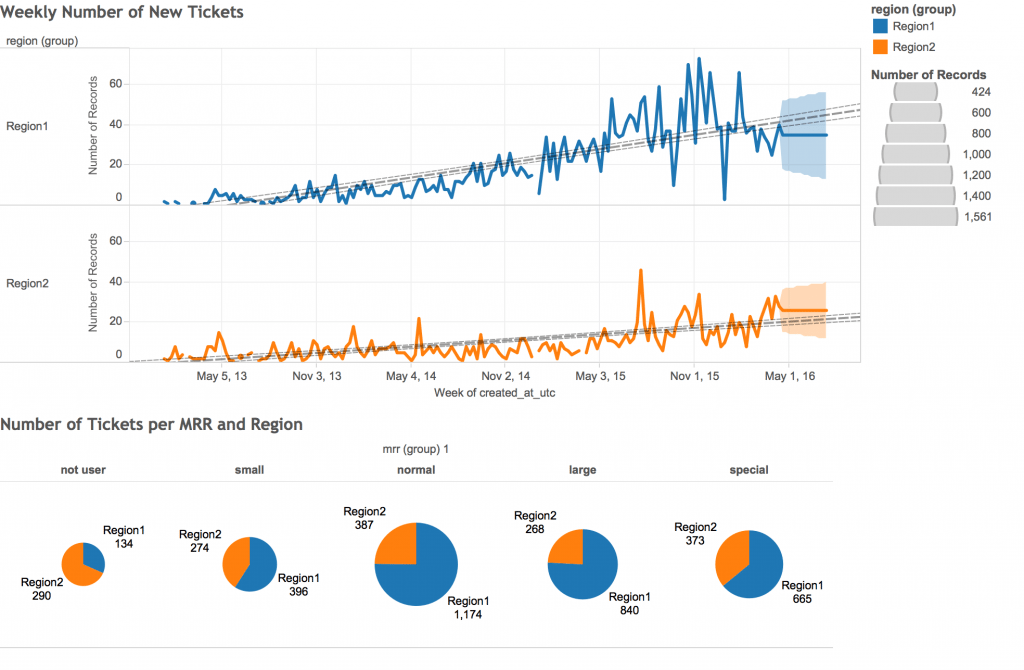
Let’s compile the data for two graphs:
- Weekly number of new tickets
- Number of Tickets per MRR and Region
The following query, when run from TD CLI (we suggest passing the SQL as a plaintext .SQL file to the query argument) or Treasure Data Console, will prepare the data we need:
Be sure to export your result to Tableau. Make a note of the data source in Tableau to which you are exporting, so that you can find it within Tableau later.
Visualizing in Tableau
After you log into Tableau Server, go to ‘home’-> ‘data sources’ and filter for the data source to which you just exported your results. You can create a new workbook with the following visualizations:
What’s Next?
Want to get the best out of your data analytics infrastructure with the minimum of expense, hassle, and configuration? Then try out Treasure Data.
Our universal data connectors can route almost any data source to almost any data destination. Want an integration we don’t support yet? Ask us!
It takes less than a minute to request a demo! You can also reach out to us at sales@treasuredata.com!
An enormous thanks goes out to our Support Manager, Toru Takahashi, for his help with and major contribution to this post.