Marketing that Works: Multi-touch Attribution (MTA) with Shapley Values Tells Marketers What Works Best
Marketing that Works: Multi-touch Attribution (MTA) with Shapley Values Tells Marketers What Works Best
Marketing that Works: Multi-touch Attribution (MTA) with Shapley Values Tells Marketers What Works Best

“Success has a million followers, but failure is an orphan,” the saying goes. That’s also true in marketing and sales: Everyone claims to have made the crucial touch that finally sealed the deal. But in an era where consumers are bombarded with many different messages, offers, and content, how do you know which touches worked to close a sale or build enduring customer loyalty? There are many different “ multi-touch attribution models ” that provide insights into what works. But which models are best for your business, and when and how should you apply them?
These questions have only become harder to answer with the growing complexity of consumer journeys across many digital and physical touchpoints, from brand websites, online ads and social media to brick-and-mortar stores.
To tackle this challenge, Treasure Data has developed a multi-touch attribution (MTA) model that combines Long Short-Term Memory (LSTM) deep learning with Shapley values, a concept developed by Nobel Prize-winning economist Lloyd Shapley. The Shapley Values model extracts meaningful statistical patterns from user journey data imported into Treasure Data’s Customer Data Platform (CDP). To date, Treasure Data is the only CDP that incorporates this advanced machine learning method of multi-touch attribution.
Understand What Converts with Shapley Values and MTA
With Shapley Values MTA, marketers can gain an accurate understanding of how different channels contribute to marketing outcomes, such as conversions. This is a major improvement over deterministic attribution models such as first-touch, last-touch or W-shaped attribution.
Unlike these deterministic models, Shapley Values MTA uses real-world user data to draw correlations among different touchpoints and measure the impact of every channel at each stage of the customer journey. As a result, marketers can make better decisions about which channels to emphasize and how to allocate their financial resources.
How Shapley Values MTA Works
In game theory, Shapley values provide a method of calculating payouts to players in a cooperative game—that is, a game where players cooperate with one another in coalitions to achieve a shared aim. Each player may contribute unequally to the outcome of such a game; some players may deserve the lion’s share of the credit, and others may barely increase the coalition’s probability of winning.
So how can we make a fair distribution of gains and costs among all the players? By calculating a Shapley value—a weighted average of each player’s marginal contribution to all the possible coalitions of players in the game.
Now, let’s treat marketing attribution as a cooperative game. The goal of the game is to produce a conversion—for example, by persuading a user to make a purchase, sign up for a mailing list, or register for a webinar. The “players” are the different marketing channels the business uses to communicate with its customers—which may include not just digital channels such as email, websites, online ads, apps and social media, but also physical channels such as stores and in-person events. For accurate multi-touch attribution, what marketers need is a way to estimate how much each channel adds to the probability of converting a customer.
Finding the Right Marketing Mix with Shapley Values
Treasure Data’s MTA machine learning model solves this challenge by calculating Shapley values for all the different channels in a company’s marketing mix or campaign. This model analyzes the journeys of different users during a lookback window—for example, the previous seven days. The model tracks each user’s interactions with different marketing channels over that time period, and checks whether the user’s journey ended in a conversion. The challenge is then to analyze the sum of all customer journeys and produce an aggregate value for each channel.
The Shapley Values MTA model performs this attribution analysis in three key steps: data transformation, LSTM deep learning, and Shapley values computation.
1. Data Transformation
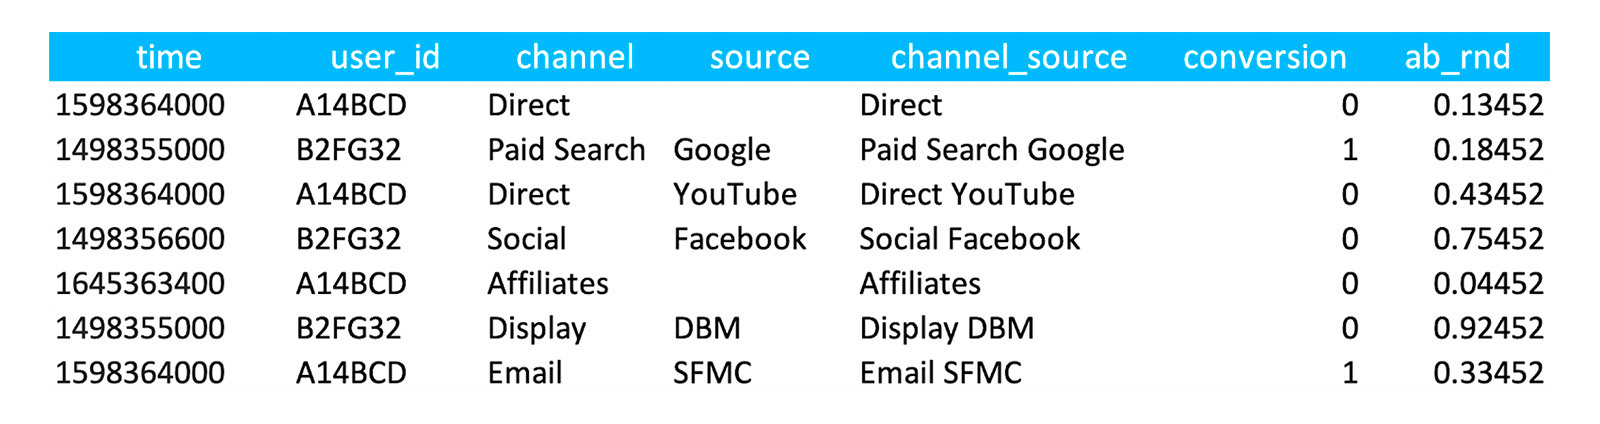
First, we run SQL functions in Treasure Workflow to unite multiple user activity tables, combining all the historical data on user touchpoints and conversion events into a single table. Each row in the table represents a time-stamped touchpoint with a unique user ID, the channel and source associated with the event, and a record of whether the event led to a conversion. We can then feed the final input table into the LSTM deep learning model (see the sample table below).
2. LSTM Deep Learning
Next, the Shapley MTA model trains the LSTM neural network on the historical data from the lookback window, tracking customers’ journeys across multiple marketing channels. LSTM deep learning excels at analyzing long-term dependencies among data points—such as a sequence of customer interactions, days apart from each other—so a LSTM model can detect meaningful patterns over relatively long periods of time.
To make this possible, each marketing channel is flagged with a list of indexes that show which day or days of the lookback period the user interacted with the channel. This allows the model to calculate the total attribution percentage for each touchpoint. It can also determine a partial attribution percentage during each day in the window. The neural network can thus learn from the historical data and estimate the probability of conversion for all existing combinations of touchpoints and sequences of interaction, across the entire user journey.
For example, a company’s CDP might contain historical data from five different channels in a marketing campaign: direct website traffic, paid search, social media, display ads, and email. The LSTM model will compute the probability of conversion for each touchpoint combination and sequence. So if one path to conversion runs from direct traffic to social media to email, and another from social media to email to direct traffic, the LSTM model will provide different probabilities of conversion for both journeys—along with all the other combinations of those five channels.
3. Shapley Values Computation
Using the LSTM’s output, the model subjects the data to random permutations, switching different marketing channels in and out of the customer’s journey for every combination of touchpoints and index positions (days). In this way, the model can assess how much the odds of conversion change every time it adds or removes a channel at specific stages of the journey. It then assigns a Shapley value for each channel, based on the aggregate change in the probability of conversion.
Based on these Shapley values, Treasure Data CDP can generate actionable insights about how different channels are contributing to outcomes. A marketing organization can customize these insights to fit various use cases, depending on its needs.
The dashboard below, for instance, displays the total attribution percentage for each channel used in a particular campaign. Direct website traffic, in this example, adds the most to the probability that a customer journey will end in conversion, at 30%, with email just behind at 27%. Meanwhile, affiliate traffic contributes the smallest share at 5%.
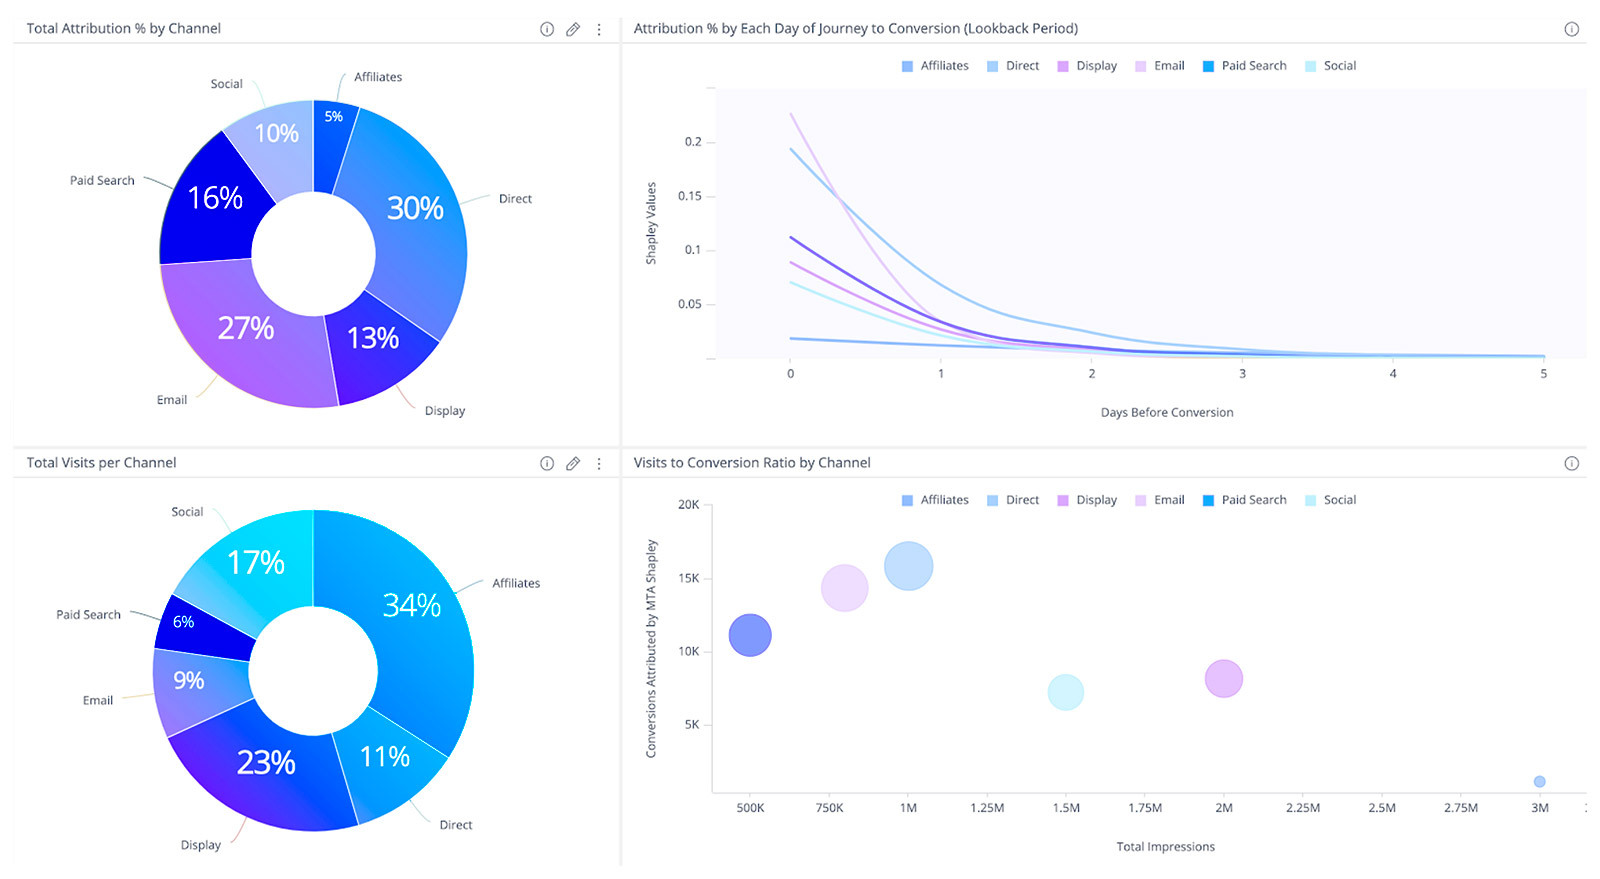
Looking at the dashboard, the marketer can view each channel’s attribution percentage for each day of a customer’s journey during the lookback period—and thus begin to understand which channels are having the most impact at each step in the customer’s path to conversion.
Direct website traffic, for example, makes an especially large contribution to conversions during the early stages of the journey depicted on the dashboard. Email soars in its impact during the last day before conversion, becoming the single largest contributor toward the end.
The dashboard also displays each channel’s percentage of total impressions and its ratio of impressions to conversions, according to the Shapley attribution model. In this way, the marketer can gauge the relative efficiency of each channel in turning opportunities for conversion into actual conversions.
Results: Stronger Planning, Smarter Budgeting, More Cost-Effective Campaigns
With insights from Shapley Values MTA, marketing teams can attribute credit for outcomes across multiple channels with an accuracy unmatched by deterministic models. Marketers can therefore plan strategies and campaigns that reflect the reality of actual customer journeys, rather than unverified assumptions about user behavior. And they can allocate their budgets more precisely across the entire mix of channels, optimizing key performance indicators such as CPA (cost per acquisition) and ROAS (return on ad spend).
In a real-world example, a global automaker recently implemented Shapley Values MTA within Treasure Data CDP to optimize lead generation across 11 different marketing channels. The company analyzed two months of data with a seven-day lookback period, encompassing more than 60 million rows of web activity data streamed to the CDP. Through four rounds of training, the neural network was optimized for compute efficiency, minimal root-mean-square error (RMSE) and minimal log loss.
Through Shapley Values analysis, the automaker’s marketing team gained insight into which channels performed the best at different stages of the customer journey and where they should allocate their resources. By looking at the total attribution percentage, they were able to understand which channels were generating empty traffic, and which ones excelled at converting users into real leads. Similarly, a daily breakdown of each channel’s contribution to conversion revealed which channels had a lasting impact on lead generation over the entire lookback period, and which channels only performed well toward the end of the window.
As this example suggests, Shapley Values MTA is not a one-size-fits-all solution. But it can be tailored to virtually any kind of touchpoint data or conversion goal.
Treasure Data’s Shapley model allows marketers to analyze attribution across not just digital channels, but also physical channels, provided the right data is available in the CDP. They can also customize the length of lookback windows and the type of conversion event they want to track. Thanks to this flexibility, any marketing organization can reap the benefits of advanced, data-driven attribution across channels.
If you’d like to learn more about advanced marketing techniques to improve targeting, stretch ad dollars, and improve and personalize customer experience, check out our free series of Data-Driven Marketer’s Guides .